case study
Order Ticker
Every shop that schedules work has the same question it keeps asking: if we promise this order for next Thursday, can we actually make it? VISUAL holds all the facts needed to answer that, but it spreads them across orders, lines, parts and dates. Nobody has time to add it all up while a customer is waiting on the phone.
The problem
Raw numbers mislead. A day with a thousand pieces of one part can be easy, and a day with fifty pieces of another can be a struggle. Counting order lines tells you how much paperwork there is, not how much work. What people really use is a sense of how busy a day is, a gut feel built over years. That knowledge sits in the heads of a few people and isn't written down anywhere.
The goal was to turn that gut feel into one number per day: a load score anyone could read without knowing how it was calculated.
The approach
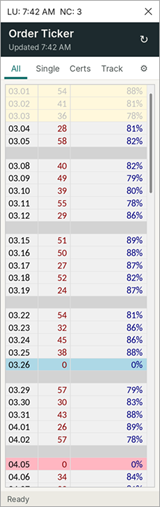
Order Ticker is a narrow window that docks at the edge of the screen and stays on top of other windows. Each row is one working day, from the current week out about four months. Each day shows its order-line count and its load score. Past days are greyed out, holidays are blue, and closed days are pink, so the open capacity stands out immediately.
The load score is where the real work is, and it's designed to be swapped out. At this plant it starts from piece counts and applies modifiers by part family. Some product types count at a fraction of their quantity, and some don't count at all, because experience says they barely touch the schedule. The modifiers are editable in the app, so the weighting can follow the product mix without a new release.
The same structure works with different inputs. Depending on what drives a shop's capacity, the score could weigh:
- Lead days: how much of the window to the promise date is already used up
- Order age: older open orders put more pressure on a day than new ones
- Machine occupancy: hours already booked on the work centers a part needs
- Staffing: planned headcount, shifts, and time off for that day
The result can be a number or a percentage of capacity. The math will be different at every company, but almost every company already has a version of it, often in a spreadsheet or in someone's head. This tool puts it on screen and keeps it current.
The window refreshes every five minutes. Each copy picks its own minute within that cycle, so a building full of open tickers doesn't hit the database at the same moment. Holidays and closed days are entered once, checked for duplicates, and removed automatically after they pass. Separate tabs break out single-piece work and orders that need certifications. Double-clicking a day lists every order line behind its number.
A Track tab answers the other constant question, where's my shipment? Search by sales order, packlist, or customer and PO. The tool lists every shipment with its date, weight, carrier, and tracking number, and drafts the customer email in one click.
The outcome
It started as one of the first internal tools at the plant and became a fixture on the desks of the people who promise dates. It has lasted because it answers one question quickly and then stays out of the way.
A later refresh added an optional modern look with a dark header, flat navigation, and card-based settings. When people tried it, they asked for the dense rows and familiar colors of the original day list back, and got them. The new design stays in the settings and navigation, and the number people rely on looks as it always has.
← back to case studies